



A science paper placed an alarming date in its title: Friday, November 13, 2026. The year was 1960, and the subject was the growth of the human head count.
The 1960 population prediction is often retold as a claim that the world will end. The more interesting story is math. A fitted growth curve can rise toward infinity at a fixed point, even though the real people it represents cannot do the same thing.
That gap between a curve and a world gives the paper its lasting value. It asks how far a past trend can be carried into the future, what assumptions hide within the calculation, and when a model stops describing reality. The date is a powerful hook.
The reasoning around it is what deserves a closer look.
The paper described a conditional outcome
The 1960 population prediction used a math model of past growth. It did not show that an event would end life on a set date. The striking result came from carrying one rule toward a point where the curve has no bound.
That if is the key to the story.
Heinz von Foerster, Patricia Mora, and Lawrence Amiot published the paper in Science. The title made a technical problem sound like a deadline. This helped the idea travel far beyond the original discussion.
A conditional model asks what happens if a stated pattern continues. It does not claim that the pattern is a law that nature must obey. The word if may be less memorable than the date.
But it does the most key work.
That is the first distinction to keep in view. A forecast can reveal a weakness in its own assumptions by reaching an impossible result. The impossible result does not then become a real event waiting to happen.
It is similar to following a road on a map until the drawn line leaves the paper. The line may be clear. But the missing world beyond the edge cannot be filled by simply extending the ink.
Calling the calculation a prophecy loses that lesson. The paper belongs to a debate about growth, models, and the forces that shape populations. It is not a schedule for a real end of the planet.
Why a curve can reach infinity while people cannot
A hyperbolic growth curve can rise toward infinity when its denominator approaches zero. This is a math feature called a singularity. Real head count counts remain finite.
So the curve's behavior near that point signals a limit in the model's usefulness rather than an actual infinite number of humans.
Consider a fraction with a fixed number on top and a shrinking positive number below. Dividing by a smaller value makes the result larger. If the lower value approaches zero, the result grows without a finite bound.
Nothing in that arithmetic requires a real world to give the resulting number. The calculation follows its rules. The world has to follow births, deaths, ages, resources, and countless other states.
This is why a singularity can be informative without being literal. It may show that a rule fitted to one interval cannot be used unchanged near the end of a forecast.
Exponential growth offers a useful contrast. It can become very large over time. But it does not reach infinity at a finite date in the same way.
Different equations can fit parts of a record while giving very different futures.
Choosing a curve is therefore a major decision, not a minor formatting step. The shape of the model carries assumptions about how the step works and how that step might change.
A total population is built from changing lives
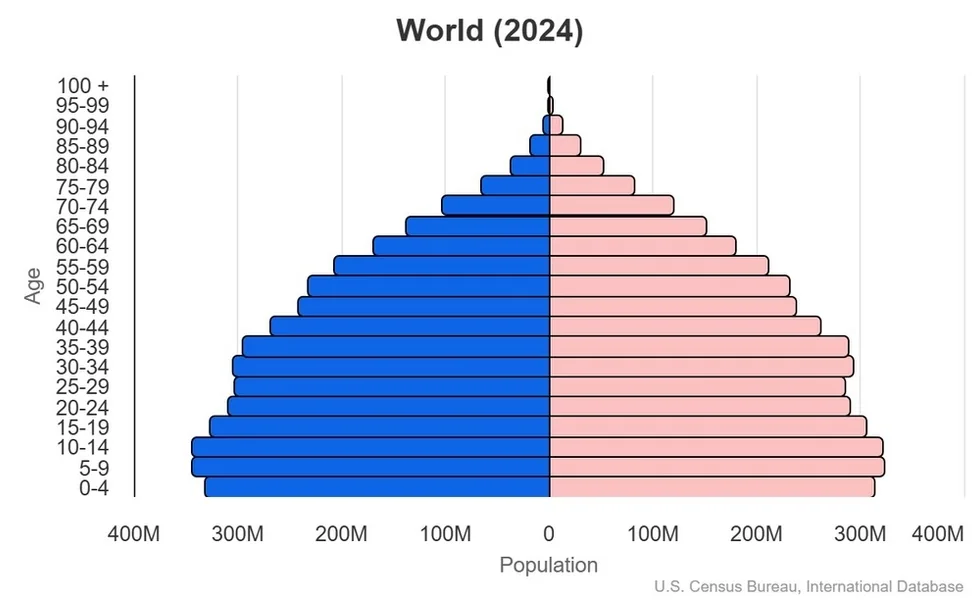
The number of people changes with births, deaths, and the age structure of those counted. A country also gains or loses people through movement across borders. These facts can change over time.
A curve built only from old totals may miss the changes taking place within the same group.
A total count looks simple because it compresses many lives into one number. Two populations with the same size can have very different age patterns and therefore different paths over the next few decades.
One may contain many young adults. Another has a larger share of older people. Even similar birth rates do not guarantee the same number of births if the number of people at childbearing ages differs.
Death rates also change with age structure and states. A model needs to grasp more than the recent difference between two totals if it aims to project those changes.
For the whole world, migration moves people between places without adding to the global total. At the national level, it can strongly alter a count. Confusing those scales can make a forecast look more simple than it is.
The United Nations' head count work uses age-based data and assumptions about future fertility and mortality. These are still forecasts, not certainties. But they expose more of the step behind the totals.
The advantage is not that every future count becomes exact. It is that a reader can ask how a changing society might lead to a different outcome, rather than treating one old line as a permanent rule.
Precision on a date is different from confidence in a model
A forecast can give an exact-looking date while remaining uncertain about its assumptions. The precision comes from the calculation, whereas confidence comes from evidence, testing, and the model's fit to the step. A memorable day should not be mistaken for proof that an uncertain forecast is sound.
A date with a day, month, and year feels stronger than a vague statement. It gives a reader something to place on a calendar. That sense of strength can come from the format rather than from the evidence.
A calculator will produce many digits from an uncertain input. The added digits do not remove the uncertainty. They can make it harder to see if the final result is quoted without context.
The same issue appears in growth curves. A small change in a fitted parameter can move a projected turning point. Different data choices may produce another estimate, even when each calculation is performed correctly.
The right response is not to distrust all numbers. It is to ask how much the result depends on its inputs and whether the model has been tested outside the data that shaped it.
Scenarios can help by showing a few plausible paths. They allow a reader to see how different assumptions affect the result instead of treating one path as inevitable.
This is the part of the old paper that still feels modern. Precise claims spread quickly. Reading them well requires slower questions about where the precision came from and what it ca really support.
The useful warning survives without a doomsday story
The paper shows why we should not push old growth trends too far into the future. A forecast needs to deal with shifts in how people live, not just fit an old line. Its lesson is about reading models well.
It is not proof of a disaster in November 2026.
A frightening interpretation can crowd out a valuable question. If the story becomes only a countdown, readers lose the chance to examine how a model turns historical data into a future path.
The better lesson is practical. Every forecast has a range in which its assumptions make sense. Outside that range, the same rule may describe a step that no longer exists in the same form.
This applies far beyond head count. A sales curve, a city's traffic count, or the growth of a new service can rise quickly and then change as states change. The past offers evidence.
But it does not issue orders to the future.
Head count itself remains a key topic. Numbers affect housing, health services, food systems, and the age balance of societies. Those questions deserve evidence and planning rather than a single dramatic deadline.
A responsible forecast can be revised when better data or changed states require it. Revision is part of the work, not a failure to keep a promise about the future.
The 1960 title continues to catch the eye because it is so bold. Its most useful message is quieter: when a curve becomes impossible, examine the model before turning the impossible number into a story about the world.
Frequently Asked Questions
These questions separate the title's dramatic language from the model behind it. The key ideas are a conditional forecast, a mathematical singularity, and the uncertainty in future population trends. Grasp those terms makes it easier to read both this old forecast and newer forecasts with care.
Did the paper predict an event that would destroy Earth?
Its dramatic date came from a head count-growth model. It did not show evidence for a real disaster occurring on that day.
What does infinity mean in this calculation?
It describes the curve becoming unbounded as a math denominator approaches zero. It is not a possible census count of real people.
Why do modern projections show several possible paths?
Different assumptions about fertility, survival, and other factors produce different outcomes. Scenarios help show that uncertainty instead of hiding it behind one precise-looking number.


.png)